
| ||||||||||||||||||||||||||||||||||||||||||||||||||||||||||||||||||||||||||||
Population ChangeThe increasing population of the world, and especially of the United States, will place huge strains on the water resources currently available. The population of the United States is increasing almost exponentially in some areas. By 2030, the populations of Arizona and Nevada are expected to double from the 2000 census population data. Ironically, these are some of the states with the highest strains on water sources to begin with. The population of California, which is estimated to be about 36,457,549 according to the 2006 census data, is expected to increase by over 12 million (US Census Bureau 2006). According to CensusScope, which uses 2000 census data, the top four states ranked according to percent growth are in the southwest. In order, Nevada, Arizona, Colorado, and Utah rank first through fourth for highest population growth with Arizona at a 66% increase. The chart below shows an estimate of how much water will be needed per day with the population increase. These numbers are staggering and reflect the extreme use of water in the United States. Something must be done to stop this great increase in water consumption because these water values are not sustainable. In combination with climate change, the people in the west will not have enough water to live on.
*Uses 2000 estimated per capita water use in each state Estimated Use of Water in the United States in 2000
Figure 1 - Image Source: Human Development Report 2006 Figure 1 reflects how water in these areas is in a physical shortage. Currently, the states with the smallest amount of water are experiencing the greatest percentage and total increase in population. As water is a finite resource, population demands will soon exceed the water available. Essentially, Mission 2012 is trying to develop a way for the demand on water in the west to decrease so that less strain is put on the environment and also so that the price of water does not skyrocket in a short period of time as the water disappears. Population increase in the west is a huge problem that is not going to be fixed easily and Mission 2012 does not attempt to stop population growth directly. Current Water Consumption and Population ChangeFigure 2 shows that the United States of America is the leading water consumer in the world. Clearly The United States far exceeds a feasible usage of water in comparison to other countries. 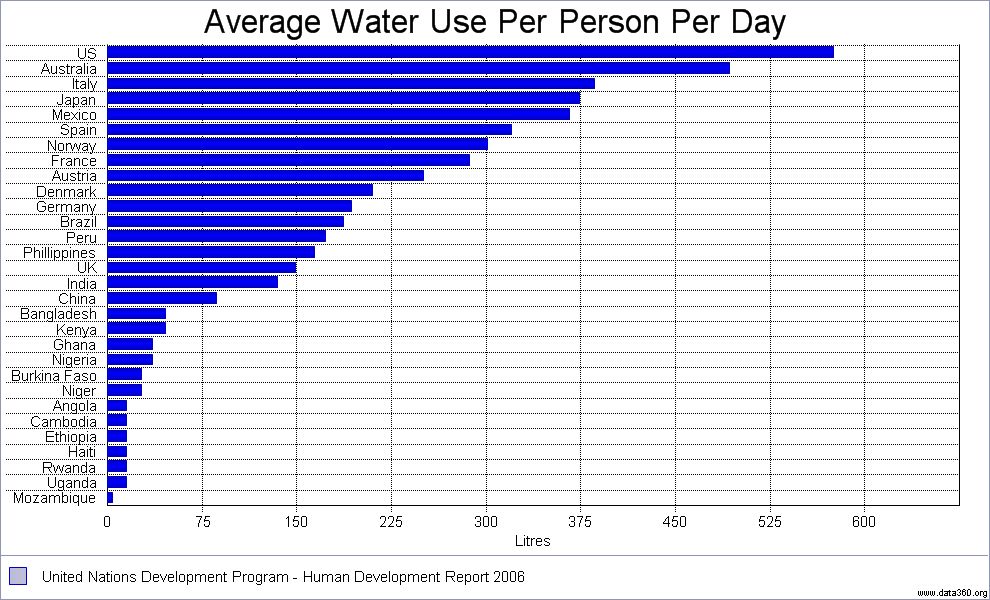
Figure 2 - Image Source: Human Development Report 2006
As stated above, Mission 2012 does not seek to limit population directly. Our solution does not put in place urban growth boundaries because of the widespread animosity that would result from such a plan. However, Mission does intend to discourage people form moving to places where there are limited water resources by increasing the price of water to reflect the scarcity of water as discussed in the economic solution. | ||||||||||||||||||||||||||||||||||||||||||||||||||||||||||||||||||||||||||||

|
|