

“ This is the way the world ends / Not with a bang, but a whimper.” ~T.S. Eliot, “The Hollow Men”
Biodiversity is crucial to most aspects of human life, including social and economic processes. Biodiversity also contributes to many ecosystem services. In their 2011 study The Economics of Ecosystems & Biodiversity (TEEB), the United Nations Environmental Programme defined four categories of biodiversity-provided ecosystem services: provisioning services, regulating services, cultural services, and supporting services (See Table 1).
| Type of Service | Service Examples |
|---|---|
| Provisioning services | Provisioning services produce physical goods that are used directly by humans. These goods include food, water, and pharmaceutical products. |
| Regulating services | Regulating services work to maintain a natural balance. Regulating services include the filtration of pollutants in wetlands, climate regulation through the carbon cycle, and disaster protection. |
| Cultural services | Cultural services are intangibles provided by biodiversity that have social value. For instance, recreation, aesthetic beauty, and education are biodiversity-provided cultural services |
| Supporting services | Supporting services are processes that are ecologically crucial. Supporting services include soil formation, nutrient cycling, and photosynthesis. |
Biodiversity is invaluable, both qualitatively and quantitatively. Qualitatively, when biodiversity is lost, part of an intricate and ancient system is also lost. The loss of biodiversity also corresponds to the loss of the very things that allow human life to thrive on Earth. Quantitatively, biodiversity is correlated to a loss of fiscally valuable ecosystem services. Ecosystem services give society so-called "dividends" from natural capital (Sukhdev, 2011). But, to allow for the continued production of these crucial dividends, natural capital (i.e. biodiversity) must be preserved (Sukhdev 2011).
This section provides a summary of both quantitative and qualitative loss and ends with a discussion of our conclusions.
Not all ecosystem service loss can be easily defined monetarily. While assigning values to provisioning services is relatively straightforward, it is difficult to assign values to non-consumptive services like cultural services (Sukhdev, 2011). The TEEB defined three types of value, which are summarized in in Table 2.
| Value | Definition/Examples |
|---|---|
| Direct Use Value | Biodiversity-provided physical goods, like crops and livestock, have direct uses value. |
| Non-Use Value | Non-use values are intangible values that do not come from the physical use of resources. For example, a spiritually important landscape has non-use value. |
| Indirect Use Value | Indirect use values result from processes that directly benefit humans but do not produce physical goods. The regulation of climate through carbon sequestration has indirect use value. |
The theory behind assigning values to ecosystem services is that knowledge regarding the economic value of biodiversity could create an incentive to preserve said biodiversity (Sukhdev 2011). Currently, many ecosystem services are vastly undervalued — this is reflected in the non-urgency and nonexistence of some conservation efforts. Values behind these services could help emphasize the need to preserve the biodiversity that provides these services.
Additionally, the loss of ecosystem services often disproportionately affects the lives of those in underdeveloped nations (Sukhdev, 2011). People in underdeveloped nations are particularly affected because they rely directly on their physical environments for sustenance. For instance, agriculture is the main economic activity for many people in third world countries. As biodiversity is lost, valuable ecosystem services that contribute to fertile soil and optimal growing conditions are also lost. As a result, those people whose livelihood depended on agriculture suffer unacceptable economic losses. This suggests an additional humanist motivation for conserving biodiversity: combatting poverty and improving the standard of living of impoverished peoples.
In a 2008 report, the European Commission estimated that biodiversity provides "ecosystem services worth 50 billion Euros per year", or about 68 billion USD. They also estimated that, by 2050, economic loss due to loss of ecosystem services would amount to almost 14 trillion Euros (or 19 trillion USD). This would be equivalent to approximately 7 percent of the world's GDP in 2050. To obtain these numbers, the European Commission used 2000 as a base year and projected "changes in land use, biodiversity, and ecosystems up to 2050." The commission also incorporated predictions regarding population growth, energy consumption, and economic development. Their analysis predicted a vast monetary loss as a result of declining biodiversity and biodiversity-provided ecosystem services.
Using a three-pronged method (see Figure 3 for a detailed summary), the TEEB placed monetary values on various ecosystems. This method involved identifying and assessing the ecosystem services present, using various methodologies to estimate the value of the services provided, and then finalizing the value and using it to promote conservation. A selection of their results is summarized in Table 4. The table highlights the large economic value of biodiversity-provided ecosystem services, but represents merely a subset of the total economic value provided by these services. The table highlights the fact that preserving biodiversity is both environmentally and economically remediating. Indeed, one report "estimated the cost of building and maintaining a more comprehensive network of global protected areas — increasing it from the current 12.5-14 percent to 15 percent of all land and from 1 to 30 percent of the seas — would be 45bn USD a year, while the benefits of preserving the species richness within these zones would be worth 4-5tn USD a year" (Jowit, 2010). While it may seem that conservation efforts to protect biodiversity are economically taxing, in the long run such efforts may actually generate revenue.
Additional results, including four case studies, can be found in the full TEEB report.
 |
| Some facts about biodiversity: |
|---|
| The reduction in global greenhouse gas emissions caused by halving deforestation rates by 2030 would avoid more than 3.7 trillion USD worth of damages, not including the benefits provided by the saved forest ecosystems. |
| Unsustainable fishing practices lead to an underperformance in fishery output of 50 billion USD annually. |
| Coral reefs are home to 1-3 million species, and are the primary source of sustenance for some 30 million people. |
| The sale of organic food and drink has increased by over 5 billion USD annually. Sales of these products amounted to 46 billion USD in 2007. |
| The watershed benefits of the Ko'olau watershed in Hawaii alone are valued at 1.42-2.63 billion. |
| Forests in Sulawesi, Indonesia provide pollination services of about 63 USD per hectare. |
Because of past environmental recklessness and poorly planned actions, the United States of America is now spending large sums on the preservation of species. This illustrates the fact that delayed action can cause financial strain as governments try to rectify past inaction. Still, even these expenditures may or may not be successful in mediating the biodiversity loss caused by past mistakes.
During fiscal year (FY) 2005, the United States devoted a total of 1,462,076,941 USD in federal and state funds (1,406,200,840 USD and 55,876,101 USD, respectively) to the preservation of 1,317 endangered and threatened species residing within the nation’s borders (US FWS 2008). In FY 2006, that figure increased to 1,701,555,843 USD (1,647,783,646 USD federal and 53,772,197 USD state), and the number of species supposedly benefitted rose (along with the number listed under U.S. jurisdiction) to 1,321 (US FWS 2008). The organism-type distributions of funds in fiscal years 2005 and 2006 are recorded graphically in Figures 5 through 8.
Figure 5: non-land acquisition expenditures in FY 2005. |
Figure 6: land acquisition expenditures in FY 2005.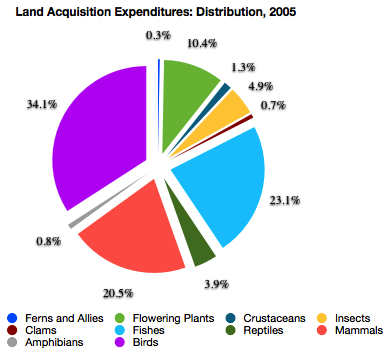 |
Figure 7: non-land acquisition expenditures in FY 2006.  |
Figure 8: land acquisition expenditures in FY 2006.  |
In both years, the primary beneficiaries of expenditures were fishes, claiming 34.0 percent (2006) to 38.6 percent (2005) of total funds (Figures 5 and 7). The chinook salmon (Oncorhynchus tshawytscha) alone received 176,999,395 USD (12.1 percent of the total) in FY 2005 and 192,248,675 USD (11.3 percent of the total) in FY 2006. Of the top ten funded populations during the former year, it received the most money (38.9 percent of 110,491,186 USD) in non-land acquisition expenditures (Figure 6). A second member of the genus Oncorhynchus, the steelhead salmon (Oncorhynchus mykiss), received 154,180,733 USD (10.5 percent of the total) in FY 2005 and 135,830,498 USD (8.0 percent of the total) in FY 2006. It received 110,491,186 USD in FY 2005 non-land acquisition expenditures (Figure 6) (US FWS 2008). Both species remained at the top of the non-land acquisition expenditures charts in FY 2006 (Figure 8) (US FWS 2008).
| Rank | Species | Location | Status | Total Expenditures | Land Acquisition Expenditures |
|---|---|---|---|---|---|
| 1 | Oncorhynchus tshawytscha (chinook salmon) | Snake River (spring and summer) | threatened | 49,118,688 USD | 2,546,404 USD |
| 2 | Oncorhynchus mykiss (steelhead salmon) | Snake River Basin | threatened | 45,658,509 USD | 2,494,842 USD |
| 3 | Salvelinus confluentus(bull trout) | lower 48 states | threatened | 39,582,947 USD | 1,069,614 USD |
| 4 | Oncorhynchus mykiss (steelhead salmon) | middle Columbia River | threatened | 38,467,076 USD | 1,860,998 USD |
| 5 | Gopherus agassizii(desert tortoise) | USA, except Sonoran Desert | threatened | 28,308,696 USD | 4,000 USD |
| 6 | Oncorhynchus tshawytscha(chinook salmon) | upper Columbia River (spring) | endangered | 28,256,428 USD | 1,807,500 USD |
| 7 | Oncorhynchus tshawytscha (chinook salmon) | Snake River (fall) | threatened | 27,820,672 USD | 1,714,500 USD |
| 8 | Oncorhynchus mykiss(steelhead salmon) | upper Columbia River Basin | endangered | 26,365,601 USD | 1,807,500 USD |
| 9 | Eumetopias jubatus(steller sea-lion) | western population | endangered | 25,256,269 USD | -- |
| 10 | Oncorhynchus tshawytscha(chinook salmon) | Puget Sound | threatened | 24,074,199 USD | 360,000 USD |
| Rank | Species | Location | Status | Total Expenditures | Land Acquisition Expenditures |
|---|---|---|---|---|---|
| 1 | Scaphirhynchus albus (pallid sturgeon) | -- | endangered | 38,892,982 USD | 7,418,057 USD |
| 2 | Oncorhynchus tshawytscha(chinook salmon) | Snake River (spring and summer) | threatened | 38,540,898 USD | 1,344,812 USD |
| 3 | Oncorhynchus tshawytscha (chinook salmon) | Snake River (fall) | threatened | 34,188,890 USD | 1,022,965 USD |
| 4 | Oncorhynchus mykiss (steelhead salmon) | middle Columbia River | threatened | 32,032,545 USD | 1,986,528 USD |
| 5 | Oncorhynchus mykiss (steelhead salmon) | Snake River Basin | threatened | 31,169,604 USD | 1,488,541 USD |
| 6 | Oncorhynchus tshawytscha (chinook salmon) | upper Columbia River (spring) | endangered | 27,241,805 USD | 2,122,779 USD |
| 7 | Oncorhynchus mykiss (steelhead salmon) | upper Columbia River Basin | threatened | 25,840,140 USD | 1,286,610 USD |
| 8 | Eumetopias jubatus (steller sea-lion) | western population | endangered | 24,791,913 USD | -- |
| 9 | Salvelinus confluentus (bull trout) | lower 48 states | threatened | 23,863,886 USD | 8,375,147 USD |
| 10 | Oncorhynchus kisutch (coho salmon) | Oregon and California populations | threatened | 20,310,735 USD | 1,736,500 USD/td> |
These figures are not unique to the fiscal years considered. Indeed, the United States devotes substantial funds to salmonoids on an annual basis, in an effort to preserve valued recreational and food species. The purpose of this case study is to emphasize factors contributing to salmonoid population losses, identify conservation projects and organizations which utilize government funding, and assert the idea that altered human behaviors could limit future spending.
Classification can be subdivided farther than the genus and species designations; a population of a species is deemed an “evolutionarily significant unit” when it exists in a state of reproductive isolation (and therefore may proceed along an evolutionary path distinctly dissimilar from its morphologically similar counterparts) (NOAA 2011: Glossary). Seventeen evolutionarily significant units (ESUs) of chinook salmon are currently recognized by the National Oceanic and Atmospheric Administration. Two of these, the Upper Columbia River spring-run and Sacramento River winter-run varieties, are designated “endangered” (US FWS 2011). Seven more, the Snake River spring- and summer-run, Snake River fall-run, Central Valley spring-run, California Coastal, Puget Sound, Lower Columbia River, and Upper Willamette River varieties, are “threatened,” per the guidelines of the Endangered Species Act (NOAA 2011: Chinook Salmon). The causes of salmon mortality can be either direct or indirect, and are addressed in large part within our proposal: the reductions of once-accessible habitats via water withdrawal and the diversion of natural water flows for agriculture and hydropower, droughts prompted by climate change, and resource extraction for human use are the primary contributors (NOAA 2011: Threats and Impacts).
In addition to artificial propagation projects which exist in order to raise chinook
salmon in a ranching style, funded hatcheries are now organized for assisted spawning
in the states of Washington, Idaho, Oregon, and California (NOAA 2011: Salmon
Harvest and Hatcheries). Recovery planning areas (recovery domains) outfitted with
teams of scientists have been developed in the Northwest Region to actuate the
preservation of salmon species within particular bounds (NOAA 2011: Recovery
Planning). The Pacific Coastal Salmon Recovery Fund, established during FY 2000,
gives money to the states of Washington, Oregon, California, Nevada, Idaho, and
Alaska in order to fund protective efforts (as described in “Pacific Coastal Salmon
Recovery Fund Performance Goals, Measures, and Reporting Framework”
The effectiveness of this extreme dedication of funds to expand the populations of endangered and threatened salmonoids has yet to be determined. In an effort to avoid future expenditures, representatives of the United States should shift their focus from the rectification to the prevention of damage, heeding the advice of the precautionary principle. The development of sustainable agricultural technologies which utilize less water and fewer fertilizers, the identification of new energy sources, and the protection of more vast expanses of habitat would contribute more readily to the recovery of species than would clean-up project funding.
Species exist; this gives them an intrinsic value that is independent of any uses that they may have. Biodiversity also has a qualitative cultural value. It is part of a heritage that has been handed down from generation to generation. If biodiversity continues to disappear from this planet at the current rate, the human race risks losing an ancient inheritance. Author Stephen Post (2004) once said that 'destroying species is like tearing pages out of an unread book, written in a language humans hardly know how to read, about the place where they live'. Within each species is the potential for unimaginably expansive evolution; 'every [unnecessary] extinction is a kind of superkilling' (Post, 2004) and, undoubtedly, a loss of opportunity for beings desperate to discover cures for ailments (and other useful compounds) which have eluded scientific endeavors and syntheses. Extinctions today may have unforeseen effects on the future as they will alter the path of evolutionary development.
Still, what is addressed within this site is not extinction in itself. The evolutionary value of competitive exclusion was well-argued by Charles Darwin in the nineteenth century. Rather, our quarrel lies with the acceleration of this process as the result of the improper treatment of species; our goal is the mitigation of the environmental consequences of human activity. Because humans are natural beings, some argue that human actions are inherently natural and thus do not require regulation. However, this argument fails to account for the human capacity to make informed decisions and to analyze the consequences of their actions. While human actions may be 'natural', they are not necessarily acceptable. The current global extinction rate far surpasses the normal background extinction rate of species, suggesting the vastness of irresponsible human contributions to the process. As perceptive beings, humans cannot help but notice the damage that is being done to the world, to its biodiversity, and, selfishly, to their potential for survival.
Anthropocentric (or human-centered) outlooks argue that only human action that directly benefits other humans has moral value, and that their duty is not to nature but to technological and social progress and, resultantly, the betterment of their own lives. Species with agricultural, industrial, or medical benefits (immediate values) fall prey to progress. Some attempt to justify these actions as a side-effect of necessary betterment. What humans may fail to recognize is the disservice that is done to the Earth, to the future, and to progress through their acts of so-called development. Pollution, carbon emissions, misuse of land, degradation of habitats, and abuse of species — activities that have direct effects — provide humans with convenience and vast quantities of food and energy, but, the development of new environments and new sources of fuel is not, by any means, spontaneous.
From a naturalistic, non-anthropocentric perspective, preserving other life forms is also morally significant. Extending this sentiment, holistic ethics emphasizes the value of the collective rather than the individual, and urges the precautionary principle. This states that, in the absence of data-supported consensus, the burden of proof is with those who insist that an environmental action or policy is harmless. We must always bear in mind that "science without ethics is blind [and] ethics without science is empty."
Qualitatively, biodiversity is worth preserving because it has inherent value. The loss of biodiversity may also lead to alterations of the evolutionary timeline. Furthermore, humans have a moral obligation to preserve the world that they have inherited.
The above information indicates that, quantitatively, preserving biodiversity has the potential to cause vast economic improvements. From a purely economic perspective, biodiversity loss has a substantial negative effect on the global market. If loss of biodiversity continues at the current rate, humans will face disastrous consequences: sustainability-wise, economically, and politically. The data presented in this report is meant to provide a motivation for biodiversity preservation. The human race cannot afford to continue losing the valuable services provided by biodiversity.