

When implementing plans to reduce biodiversity loss, it is important to have a method of measuring the progress and overall success of plans. One way this can be done is by using the environmental indices that have already been developed and are those that are currently in development. These indices, created by various organizations, provide concrete data to back-up projects. The Convention on Biodiversity created the Biodiversity Indicator Partnership to promote the development of multiple indicators. The convention was established in 1993 in an international effort to conserve biodiversity, provide sustainable methods for the use of biodiversity, and to assure fair sharing of the benefits of biodiversity. This convention is comprised of 193 parties, including countries such as such as Belgium, Egypt, and Zimbabwe. Over forty organizations have collaborated in creating an extensive list of 17 indicator indices.
Using these indicators as a way of monitoring our progress will be beneficial in multiple ways. These indices are already well established and have organizations that are already dedicated to their continued use. As new data is found, these indicators are updated. For example, some indices, such as the IUCN Red List, are updated yearly.
The Red List's two main goals are to identify and document which species specifically need attention. From this information, they infer the global state of change in biodiversity. Red List findings are freely available to the public online. They are published every four to five years, generally at the time of the World Conservation Congress.
To meet the above goals, the Red List aims to establish a baseline from which to measure future changes and to globally contextualize the information. The Red List also designates particular species as biodiversity indicators, such as keystone species and umbrella species. Keystone species are species that are significant to an ecosystem. If a keystone species is removed, the whole ecosystem might be altered. An example of a keystone species is the beaver, which dams bodies of water when building its home. An umbrella species is a species that is considered to be "charismatic" to the public, and if targeted by conservation efforts, other species would also benefit. An umbrella species is mostly important in terms of a public relations standpoint.
Other scientists and research bodies also conduct their own biodiversity assessments, which are then approved by the IUCN. The approval process is currently being modified so that there can be a quicker turnaround for measuring progress with set goals.
The IUCN approval criteria are that the assessment must be global, it must use the same taxonomy that the IUCN uses, and that it must include IUCN documentation. Red List authorities also must check any assessment for consistency.
A group called Conservation International is an example of a group that could submit their work to the IUCN for approval. Their special rapid biodiversity assessment method involves doing a quick survey or inventory of taxa in 5-7 days. This generally takes 2 months for a preliminary report to be filed, and a year for the report to be published. Conservation International has a special formula that they use based on this weeklong survey that can help them evaluate ecosystem health.
The Living Planet Index (LPI) is also used to measure biodiversity and is considered to be a statement of the general current situation in biodiversity globally. The Living Planet Index only measures populations of vertebrates, but it does so in both tropical and temperate regions. The index's main partners are the World Wildlife Fund and the Zoological Society of London. The index has been measuring populations and compiling graphs to demonstrate trends in biodiversity since 1970. 1970 is used as a baseline for the index, and so the index value was arbitarily set to as 1.0 in that year. The LPI monitors roughly 7,000 populations of animals, covering approximately 2,300 species of mammals, birds, reptiles, and amphibians. The report for the global LPI is conducted by averaging the temperate LPI and tropical region LPI. As can be seen below (Figure 1), overall biodiversity decreased from 1970 to 2005. This decrease means that monitored species populations have decreased and that overall diversity has decreased, even if no species populations have reduced to zero (gone extinct). The Living Planet Index is a good index to use to monitor global biodiversity because vertebrates are a key component of their ecosystems as they are important links in food webs and are often keystone species.
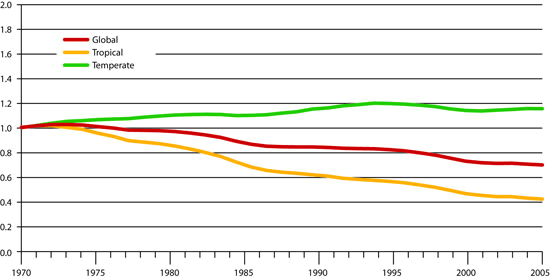 |
The Global Wild Bird Index uses bird species as a method of measuring the health of the environment. This index measures the population of wild bird species. The baseline was established in 1980 and was arbitrarily set at 100. The main partners involved in developing this index include Bird Life International and the Royal Society for the Protection of Birds. It is different from the Living Planet Index in that it utilizes trend data only from formal scientific surveys of breeding bird species. This provides a scientifically meaningful indicator for biodiversity . Because of the strict requirements on data, not all regions have large amounts of data available. However, this index can still be used to assess the current situation of many major areas with regards to biodiversity. Many of the monitored species, some of which are highlighted from the U.S. and Europe, have shown a decrease in overall population. This indicates a loss of biodiversity and will be helpful in monitoring our overall progress.
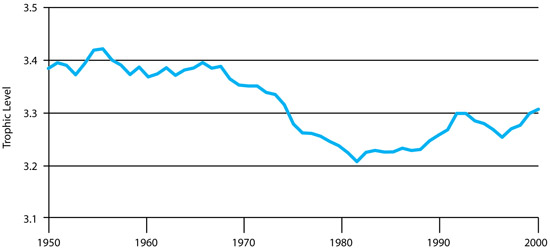
The Marine Trophic Index (Figure 2) can be used as a measure of the interactions of global fisheries and marine ecosystems. The catch composition data is collected by the Food and Agricultural Organization of the United Nations and aggregated into this index. The Marine Trophic Index has been calculated for the Exclusive economic zones of all countries and all large marine ecosystems. The baseline for this index was set at 1950. This index can be used on a scale ranging from global to sub-national. It can be used to observe trends in broad categories, such as crustaceans, or specifics categories, such as individual species.
The Marine Trophic index has generally decreased. The recent growth is due to expansion of fisheries into areas outside the monitored large marine ecosystems.
 |
There are also indices that describe trends in invasive alien species. For the intents and purposes of this indicator, invasive alien species (IAS) are defined as plants, animals, or microorganisms outside of their natural geographic range whose presence threatens biodiversity, food security, or human health and economy . Globally, IAS present the second largest threat to biodiversity. In some specific regions - mostly islands - they present the greatest threat. IAS are tracked in two main indices. One index simply counts invasive species per country; this is called the status of alien species invasion. The other main indicator is related to the Red List Index, and basically measures whether and how specific changes in Red List Indices are driven by IAS. Below (Figure 3) is an example of IAS impact on birds. The graph displays what percentage of Red List category changes were due to IAS in given time periods. The IAS indices' main partners are the Global Invasive Species Program, Bird Life International, and the Center of Excellence for Invasion Biology. Future development for this indicator is expected to add more countries and taxa to data collection and update policy and Red List methods of indication.
 |
Using indices as an indicator has advantages and disadvantages. Indices proved a quantifiable method of tracking the progress of biodiversity. Through the use of multiple indices, the biodiversity across the major ecosystems are covered. On the downside, some species may not be accurately accounted for because some indices focus on specific types of animals. Still, overall, using these indices is a good way to monitor our progress.