Images for 'Urban Sprawl'
 |
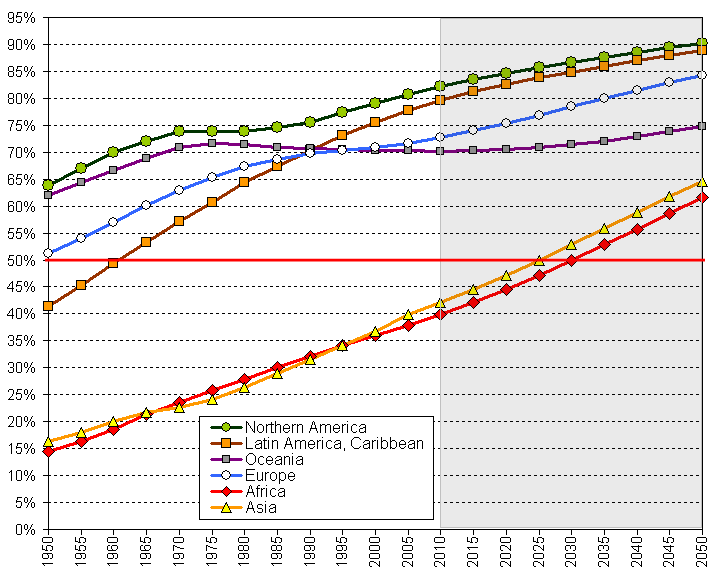
Figure 1: Urban population by major geographical area (in per cent of total population) (World Urbanization Prospects, the 2009 Revision, 2011)
Return to "Problems: Urban Sprawl" or "Solutions: Urban Sprawl"
 |
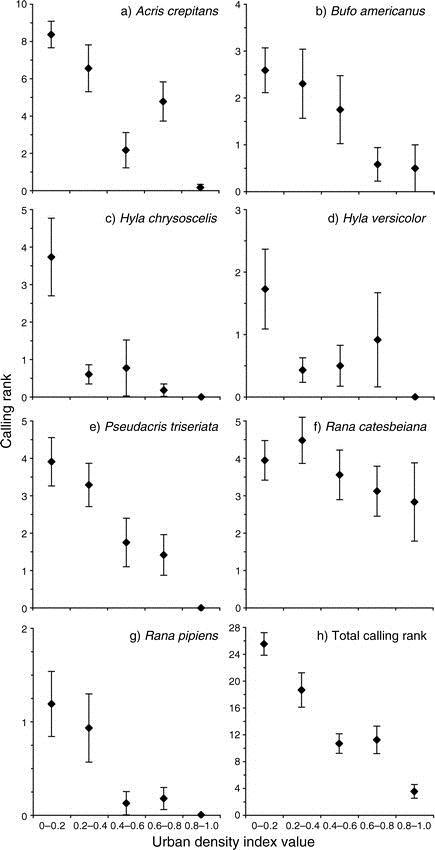
Figure 2: Calling Rank vs. Urban density index for frogs in Central Iowa (World Urbanization Prospects, the 2009 Revision, 2011)
Return to "Problems: Urban Sprawl" or "Solutions: Urban Sprawl"
 |
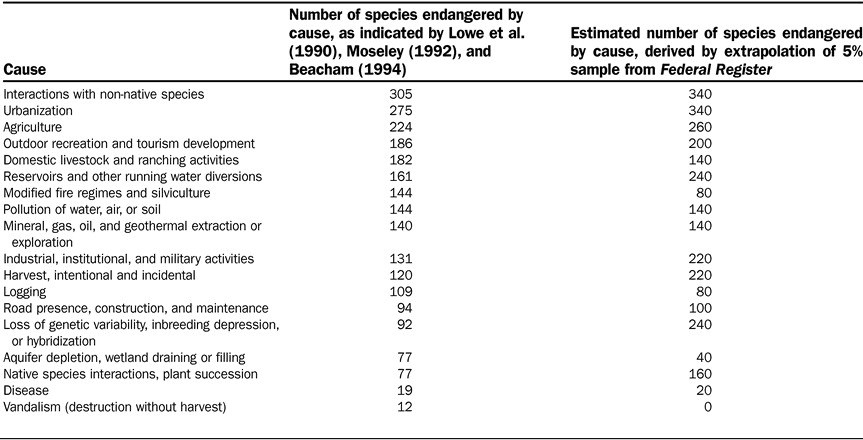
Figure 3: Causes of endangerment for American species classified as threatened or endangered by the US Fish and Wildlife Service. (Czech, Krausman, & Devers, 2000)
Return to "Problems: Urban Sprawl" or "Solutions: Urban Sprawl"
 |
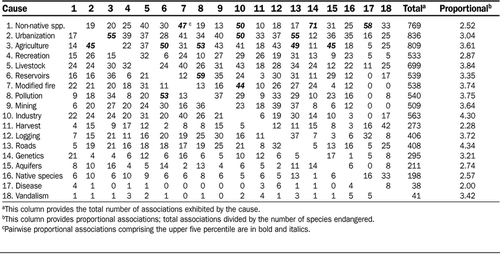
Figure 4: Associations among species endangerment causes.causes."Each cell indicates the percentage of species endangered by the cause specific to the column that is simultaneously endangered by the cause specific to the row. For example, 19% of the species endangered by cause 2 (urbanization) are simultaneously endangered by cause 1 (non-native species), while 17% of the species endangered by cause 1 (non-native species) are simultaneously endangered by cause 2 (urbanization). To find the cause most frequently associated with recreation, for example, look for the highest figure in column 4, not in row 4. (The cause most frequently associated with recreation is urbanization.)"(Czech, Krausman, & Devers, 2000)
Return to "Problems: Urban Sprawl" or "Solutions: Urban Sprawl"
- Works Cited
- Czech, B., Krausman, P. R., & Devers, P. K. (2000). Economic associations amoung causes of species endangerment in the united states. BioScience, 50(7), 593-594-601. doi:10.1641/0006-3568(2000)050[0593:EAACOS]2.0.CO;2
- World urbanization prospects. (2009). Population Division of the Department of Economic and Social Affairs of the United Nations.


