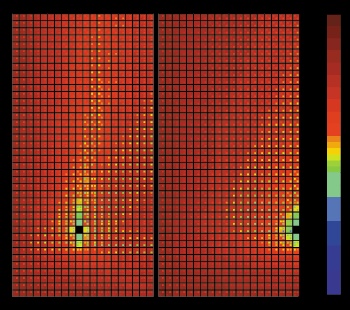
Mountains of data, displayed as a pattern of colored squares within squares, tell NASA scientists how well an oribiting satellite can measure properties of particles in Earth's atmosphere.
Detail of a matrix showing results of tests comparing thousands of models and observations made by a new satellite instrument, the Multi-angle Imaging SpectroRadiometer, which measures properties of particles in Earth's atmosphere. For each comparison, five kinds of numerical data are displayed as a pattern of four colored squares on a fifth background color.
Image from Ralph Kahn, Jet Propulsion Laboratory/ California Institute of Technology.
See: Kahn et al., J. Geophysical Research 103, 32195-32213, 1998)