Cathodoluminescence
The reflected-light optical microscope is used to focus on the sample being examined. The electron beam focus is adjustable. By adjusting the objective lens current, the electron beam can be focused on different planes as the working distance is changed by raising or lowering the sample stage. Since the optical microscope has a fixed focus, it is used to focus on a definite plane by moving the sample stage up or down, thus meeting the geometrical requirement for quantitative analysis by wavelength dispersive spectrometry. The same optical system is used to examine the cathodoluminescence (CL) signal, i.e., light produced by some semiconductors and insulators upon interaction with the electron beam. During CL analysis, the optical microscope is not available.
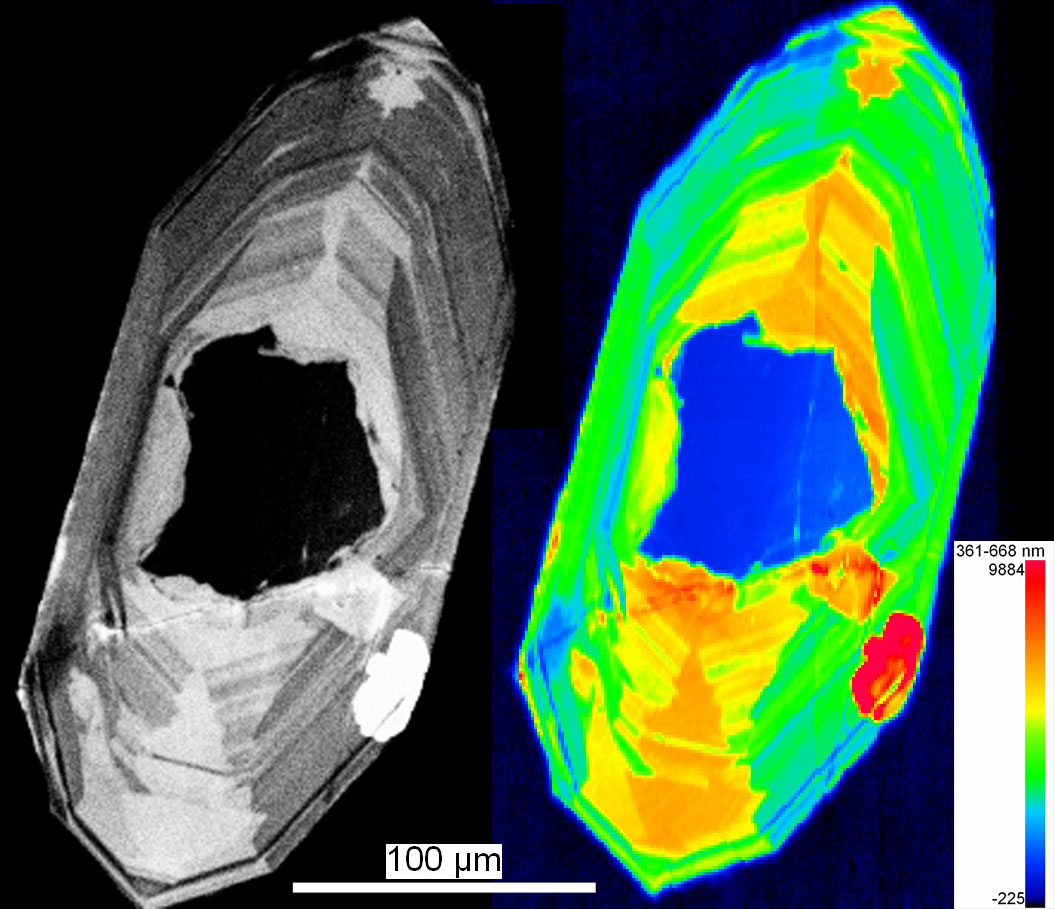
On the JXA-8200, the light from the sample is channeled into a cathodoluminescence spectrometer through a fiber-optic cable. Hyperspectral CL imaging and quantitative spectral analysis is performed with the xClent software. Color CL images can be obtained with this method. Below is a comparison of a greyscale CL image obtained with the JXA-733 and a color CL image obtained with the JXA-8200 of the same zircon grain:
Greyscale CL imaging on the JXA-733 is performed by replacing the ocular of the optical microscope with a photomultiplier. The photomultiplier and electronic circuitry used for secondary electron imaging system are used to collect the CL images. Secondary electron imaging is disabled during CL imaging. This method is useful for collecting quick, greyscale CL images of zircon. Fine-scale sector- (sz) and oscillatory- (oz) zoned CL images of zircons with overgrowth rim (og) are shown below:

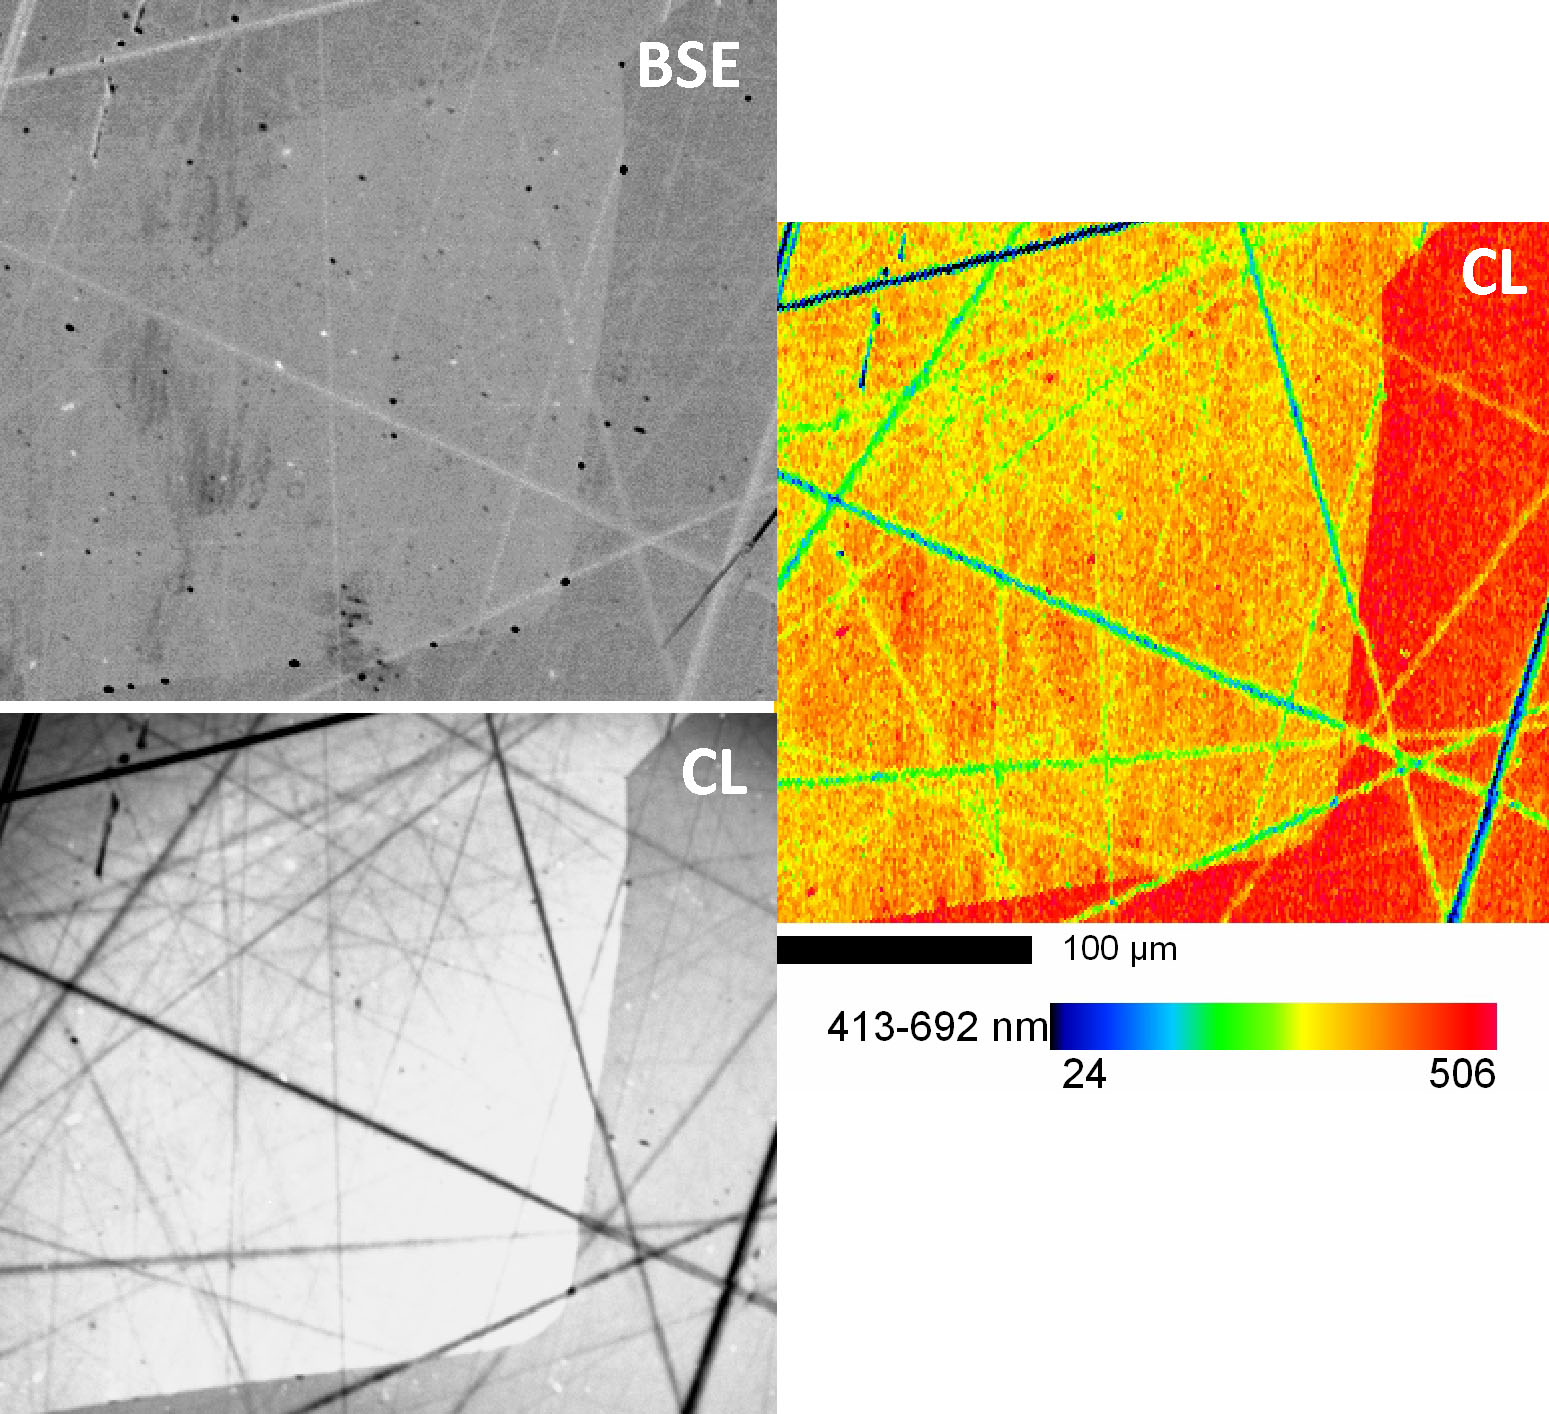
Another example compares a back-scattered electron image with a greyscale CL image and a color CL image of a grain of ZnO: